“Solving sizing in fashion e-commerce: How to navigate virtual fitting rooms”
The Sizing Problem
Sizing in fashion has long-rooted problems: a brief history

Harrods department Store, circa 1905
Source: www.commons.wikipedia.org
The history of fashion sizing is engrained in the shift from bespoke tailoring to mass-produced ready-to-wear clothing. Before the 19th century, clothing was always custom-made, with tailors creating garments based on individual measurements. Standardized sizing began with military uniforms in the 1800s, which required efficiency and consistency. Chest measurements were the foundation for men's sizes, but women's clothing remained custom or pattern-based for decades.
The first major step toward standardizing women's sizes came with the USDA's 1939 study, which collected body measurements from thousands of American women. However, the data was skewed due to a lack of diversity among participants and questionable methodologies. The 1949 National Bureau of Standards (USA) study refined this data, leading to the introduction of the “Commercial Standard” in 1958, which categorized sizes into ranges like "Misses" and "Women." Despite these efforts, sizing struggled to account for diverse body shapes and was often criticized for reinforcing the idealized hourglass figure.
Enter the changing or fitting room
Fashion retail began in small, specialized boutiques in 17th and 18th-century Europe, particularly in Paris. These early shops catered to aristocrats, offering custom-made garments and exclusive access to the latest trends. Boutiques allowed customers to interact directly with shopkeepers and try on items, introducing an early version of the fitting experience.
By the mid-19th century, grand department stores like Le Bon Marché in Paris and Harrods in London expanded on this idea, introducing fitting rooms to accommodate a growing middle class eager for ready-to-wear clothing. Changing rooms became a fixture, offering privacy and enhancing the allure of shopping by helping consumers visualize themselves in their purchases.
These early practices laid the groundwork for modern retail habits, and engrained in the modern consumer the habit of trying on clothes (or shoes) to assess their fit.
Sizing inconsistencies: an endemic challenge
Inconsistent sizing across clothing brands is a widespread issue driven by multiple factors related to industry practices and market strategies. One major reason is the lack of universal sizing standards. Brands often develop their own sizing charts to cater to specific customer demographics, creating variations based on their target audience's preferences and body types. For example, a brand catering to younger, fashion-forward consumers may use smaller fit models, while those targeting older or curvier demographics may adopt more generous sizing. This individuality allows brands to differentiate themselves but leads to significant inconsistencies for shoppers.
Inconsistent sizing is not only a result of differing brand strategies but also stems from the complexities of product development processes. A garment's sizing often starts with a single fit model chosen based on the creative director's vision, which may not represent the brand's broader customer demographic. This top-down approach prioritizes aesthetic ideals over inclusivity, creating patterns and sizing that fit the model but fail to align with the diversity of real body shapes within the target audience.
Furthermore, brands that rely on external manufacturers or suppliers frequently delegate the creation of paper patterns to these third parties. While this practice streamlines production, it introduces deviations from the brand's intended sizing because of differences in interpretation, expertise, and regional size norms used by the supplier. These variations are compounded by the absence of robust quality controls to ensure consistency across different production batches. Consequently, the size labeled on a garment may not match the brand's advertised standards, adding another layer of frustration for consumers trying to navigate already inconsistent sizing.
Historical shifts in sizing standards further complicate the issue. Over decades, societal ideals of body shapes have evolved, influencing how garments are designed and labeled. Practices like vanity sizing, where garments are labeled smaller than their actual size to boost consumer confidence, have exaggerated this problem. Additionally, geographic variations, such as differences between U.S., European, and Asian sizing systems, amplify confusion.
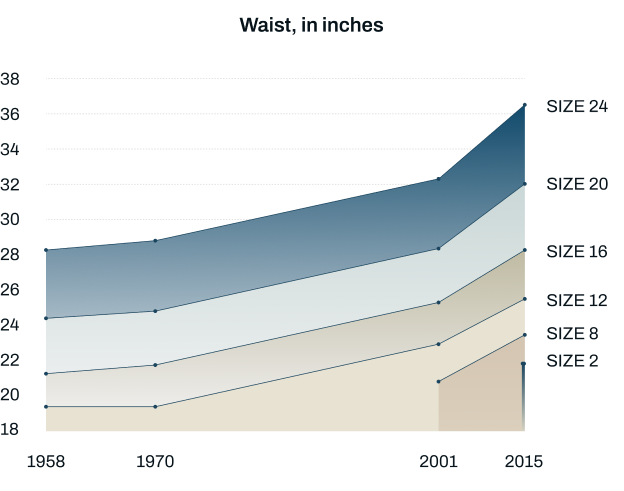
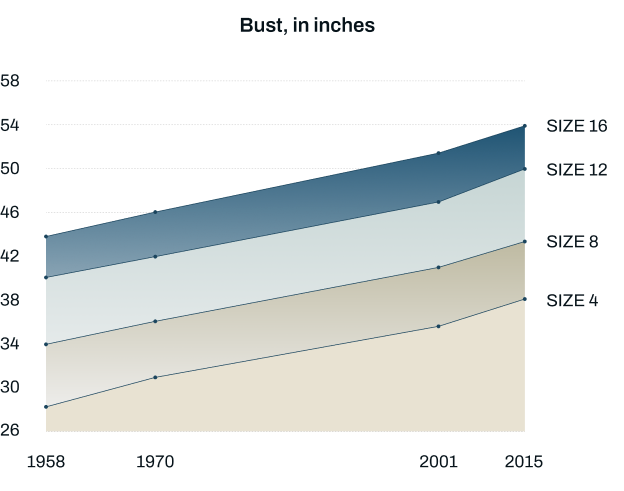
“Impact of Vality Sizing on Waist and Bust” - Charts created by The Washington Post using statistics released by the American Society of Testing and Materials and created by data visualiser, Max Galka
E-commerce's response to sizing issues: the size chart
The fashion e-commerce size chart emerged as online shopping gained popularity in the late 1990s and early 2000s, becoming a key tool for brands to address the absence of in-person fitting rooms.
Initially, these charts were straightforward, providing a general guide based on assumed standard body measurements. However, as online shopping exploded, brands sought to streamline the digital experience, often adopting a single size chart per gender to cover their entire catalog, regardless of product or fit. This practice, while efficient for retailers, often left consumers confused and frustrated, as it failed to provide the nuanced guidance needed for the wide variety of fits and materials offered by modern apparel. It also overlooks critical variations in design, such as slim-fit versus oversized styles, the stretchiness of fabrics, or seasonal differences like winter coats versus summer dresses. A size guide for a stretchy jersey top might not accurately translate to a rigid denim jacket. By treating all garments as if they conform to a single standard, brands inadvertently create a disconnect between consumer expectations and the actual fit of their products.
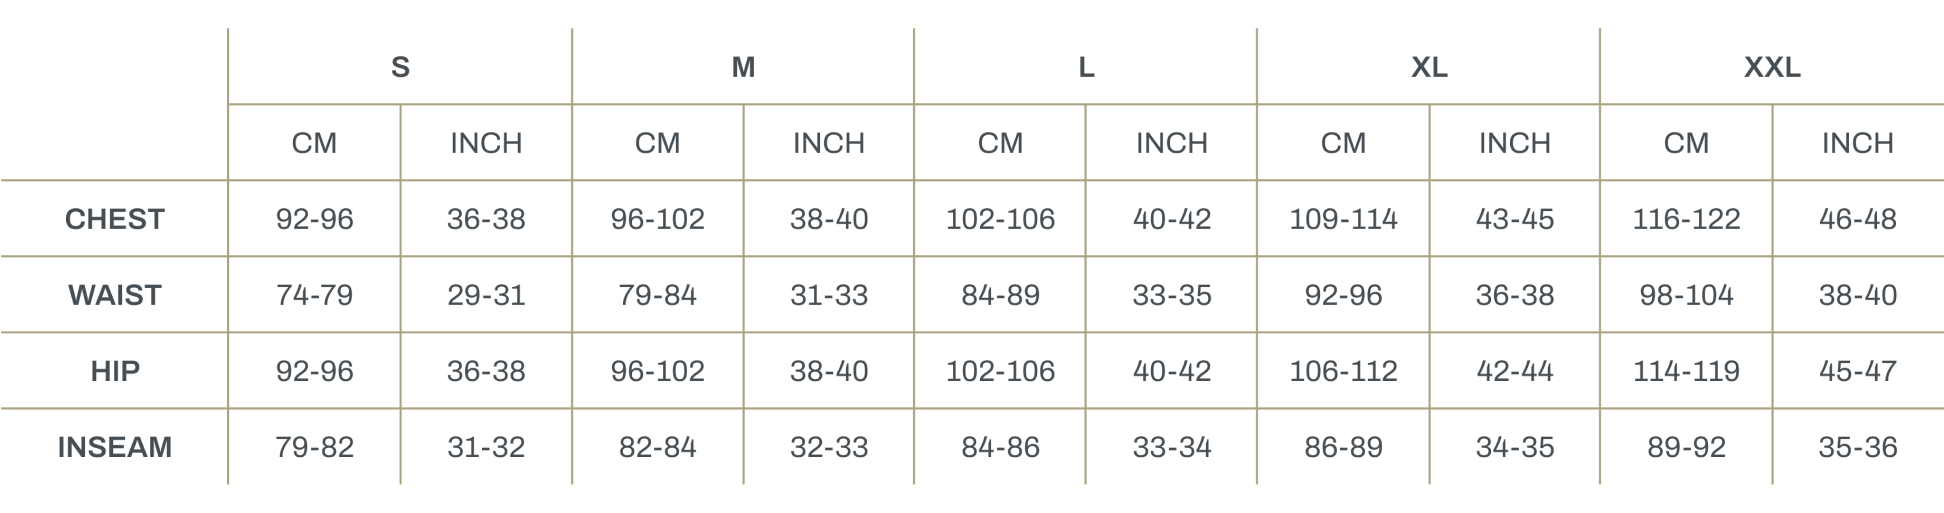
Men's Ambiguous Clothing Size Chart
Source: www.evo.com
Another persistent issue with fashion e-commerce size charts is the ambiguity over whether they reflect body measurements or garment dimensions. This lack of clarity can mislead consumers; for instance, a "bust" measurement might refer to the circumference of the wearer's chest or the finished garment, which will fit differently depending on ease and cut. This confusion is compounded by inconsistent terminology, leaving consumers unsure how to interpret the provided numbers or how closely they should adhere to the chart when choosing a size.
E-commerce size charts are further undermined by inconsistencies in product development and manufacturing. As previously discussed, deviations in sizing can occur during the pattern-making process, especially when external suppliers are involved. This results in garments that don't consistently match the size chart. Quality control failures can exacerbate this problem, with variations between production runs leading to discrepancies even within the same size. Consequently, consumers who rely on size charts may still end up with ill-fitting garments, discouraging trust in online sizing tools.
Even in the best-case scenario—where size charts are accurate and transparent—they remain underutilized by consumers. Many people lack access to measuring tapes at home or may find the process of taking their own measurements cumbersome. Even when they attempt it, human error is common, particularly with difficult-to-measure areas like shoulders or bust. For example, a woman measuring her bust may drop the tape (or keep it too tight) as she attempts to measure around her back, or someone measuring their shoulders may misjudge the correct points to include (additionally to not being able to reach them).
This combination of effort and potential for error discourages consumers from engaging with size charts, leaving them to rely on guesswork or familiarity with a brand's sizing, which often proves unreliable.
Other resources for the online fashion shopper: pictures and fit information
When shopping online, the imagery of models wearing the product is one of the most prominent tools available to consumers for gauging size and fit. However, these visuals are unreliable due to the priorities behind their creation. Fashion photoshoots are designed to make garments appear as appealing as possible, focusing on aesthetics rather than providing accurate fit information. Models often wear samples, which may not align perfectly with production sizes, and stylists routinely modify garments to improve their on-camera appearance. For instance, pins or clips are used to adjust the fit of the garment to the model's body, masking potential issues like excess fabric or misaligned proportions. Even when brands include the model's height and weight, these details are often insufficient, as they do not account for variations in body shapes or how the fabric drapes differently across diverse builds, and combined with the highly-altered photoshoots can be flat-out misleading.
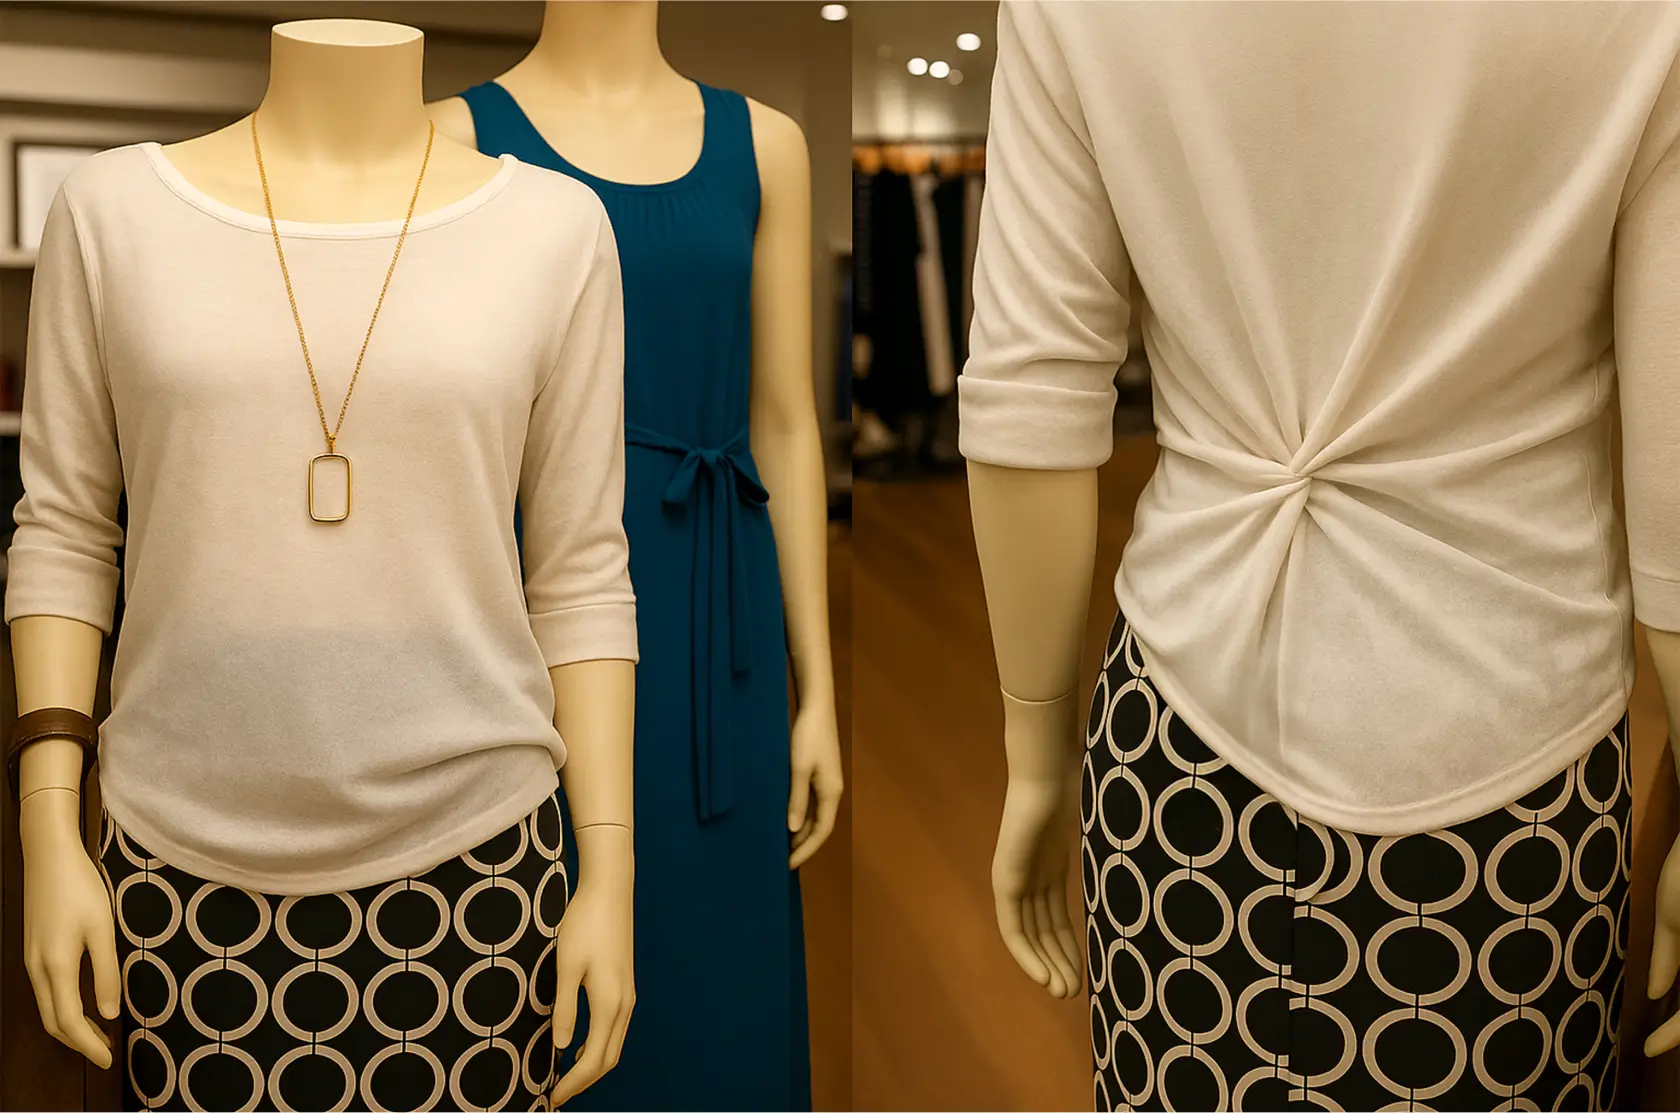
Clipped blouse on a mannequin
Source: AI
Another challenge lies in the frequent absence of essential product information that could help consumers make informed decisions about sizing. Critical details like fabric composition, stretch, and intended fit (e.g., slim, regular, oversized) are often missing from product descriptions. This gap arises from systemic inefficiencies in the fashion production process. Brands frequently fail to transfer data from product lifecycle management (PLM) or enterprise resource planning (ERP) systems into their e-commerce platforms. Even when this information exists in technical documents, it is rarely made accessible to e-commerce systems (e.g. PIM - Product Information Management). As a result, fit descriptions or fabric details are either omitted or inaccurately guessed by content creators, relying on misleading imagery (see photoshoots discussed above) rather than technical specifications. This disconnect between the product's intended fit—shaped during development by patternmakers and creative directors—and the messaging presented online leaves consumers without reliable guidance, compounding their difficulty in selecting the right size.
The Cost of the Sizing Problem
The canary in the coalmine: Returns
The challenges of selecting the correct size in online fashion shopping significantly contribute to high return rates. Practices like "bracketing"—where consumers order multiple sizes or colors and return the unwanted items—are prevalent. In Europe, online fashion return rates vary between 20% and 40%, depending on the category. Dresses and skirts often see return rates exceeding 50%, primarily due to fit issues, which account for 60-70% of returns in categories such as pants, footwear, and dresses.
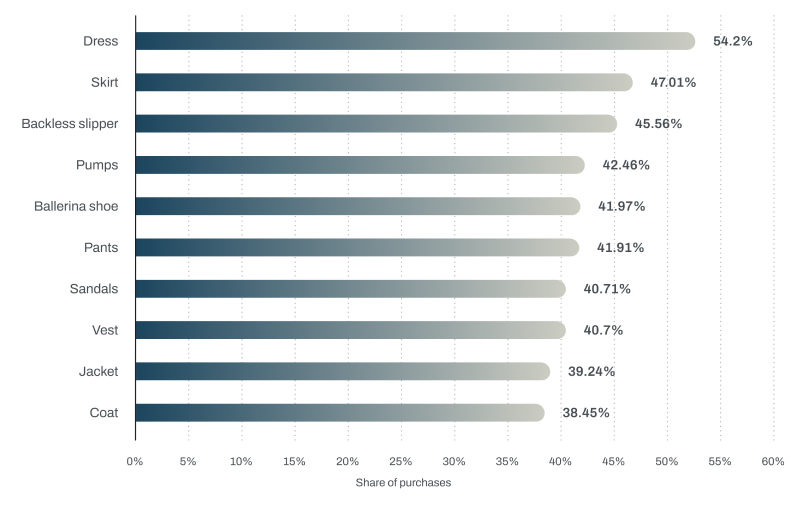
Fashion items with highest online return rates in Europe in 2022
Source: www.statista.com
Managing these returns is costly for retailers. Expenses include shipping for both the initial delivery and the return, as well as costs associated with inspecting, repackaging, and potentially repairing or cleaning items for resale. For inventory-sensitive products, returns can lead to missed sales opportunities, especially in popular or hard-to-find sizes. Less than 20% of fashion returns result in an exchange, and items returned late in the season often lose value, necessitating steep discounts. Additionally, some returned goods are unsellable due to damage or wear, adding to waste and costs.
The unit economics of returns are significant. Each return costs retailers an estimated $20-$30 per item, considering shipping, labor, and loss of value. According to 2024 NRF's Consumer Returns in the Retail Industry report, for every $100 of merchandise sold online, approximately $17 is returned, with variations depending on the brand and segment. High return rates exacerbate logistical inefficiencies, as returns must be reintegrated into supply chains.
Overall, returns represent a substantial financial burden for fashion retailers. In 2023, the global reverse logistics market, which includes returns, reached $700 billion, with fashion accounting for a significant portion. For individual brands, returns often represent 10-20% of gross sales. For instance, a $1 billion brand could face $100-$200 million in annual return-related costs, significantly impacting profitability, especially for brands offering free returns—a common practice historically designed to attract customers. According to a 2023 study by Coresight Research, in the US alone returns cost the Apparel industry 38B$ per year.
To mitigate these challenges, some retailers are implementing return fees. A 2024 study by Virgin Media O2 Business revealed that 60% of British shoppers would stop patronizing retailers if charged for online returns, with 47% having already been charged, some over £5. Although 42% still expect free returns, the trend of return fees is growing due to rising operational costs. Retailers risk losing especially younger shoppers, important for e-commerce growth, as 58% of 18-24-year-olds commonly buy multiple sizes to return non-fitting items.
A less-obvious cost: Customer Service burden
Customer inquiries about sizing place a substantial burden on fashion's customer service teams. Estimates suggest that sizing-related questions account for 25% to 40% of all customer service inquiries in the fashion sector. Resolving these queries often requires back-and-forth communication, taking an average of 5-10 minutes per interaction, depending on the complexity of the sizing question and the availability of detailed product information. With fashion retailers processing thousands of orders daily, this equates to hundreds of hours of customer service time spent weekly on sizing issues alone. This ends up increasing operational costs and delaying service for other customer needs, potentially costing sales to brands.
Opportunity cost 1: Conversion Rates
Sizing uncertainty significantly impacts consumer purchasing behavior in the fashion industry. Approximately 52% of shoppers hesitate to complete a purchase when unsure about fit, making it a leading cause of cart abandonment.
Additionally, a 2023 study found that 58% of consumers prefer purchasing from brands whose sizing they are familiar with, highlighting the importance of consistent sizing in driving sales.
This hesitation is particularly pronounced among first-time buyers, who lack prior knowledge of a brand's sizing standards, thereby affecting a retailer's ability to attract and convert new customers.
The financial implications of missed sales due to sizing uncertainty often surpass the costs associated with handling returns. While processing a return costs fashion retailers approximately $20-$30 per item, the gross margin lost from a failed conversion is substantially higher. For instance, with an average transaction value of $100 and a gross margin of 50%, a single lost sale equates to $50 in lost profit—nearly double the cost of processing a return.
In the luxury segment, this ratio is even more pronounced. Moreover, improving conversion rates by addressing sizing concerns can generate additional revenue, which may offset return-related losses and create economies of scale in logistics.
Opportunity cost 2: Average Order Value
Many consumers are reluctant to purchase multiple items or more expensive products when uncertain about fit. According to Invoca research, 81% of consumers feel more confident making purchases, including high-value ones, when they have access to information that resolves their doubts, such as sizing clarity. According to another 2020 study, 49% of consumers are more likely to add 1-2 items to their basket if they can be confident of purchasing the right size. This lack of confidence in sizing often leads to lower Average Order Values (AOV), as customers opt for fewer or less expensive items to minimize perceived risks.
Moreover, a 2020 McKinsey study indicates that when shoppers encounter uncertainties—such as concerns about choosing the wrong size—they may forgo higher-priced products or stick to brands they already trust for consistent sizing. This behavior highlights a significant missed opportunity for retailers, especially when high-value items yield greater margins. In fact, the hesitation around sizing not only reduces the volume of purchases but also shifts demand away from premium categories, exacerbating the AOV gap.
Intangible costs: Brand Loyalty and poor User Experience
The importance of fit for fashion and the difficulty of finding the right size negatively impacts brand loyalty and customer experience by creating frustration, putting consumers through the painful process of managing returns, and eroding trust. When customers experience inconsistent sizing or are unable to find the right fit, they often resort to "bracketing" — ordering multiple sizes of the same item and returning the ones that do not fit. While this practice allows customers to ensure they get the right fit, the hassle of returning items significantly reduces satisfaction. Studies show that 62% of shoppers consider ease of returns and accurate sizing information key factors in their decision to shop again with a brand. Frequent negative sizing experiences can lead to a loss of repeat customers, as dissatisfied shoppers are more likely to explore competing brands that promise better fit reliability.
Moreover, the negative customer experience associated with sizing issues damages long-term brand loyalty by disproportionately affecting new customers. First-time buyers, who lack familiarity with a brand's sizing standards, are particularly vulnerable to frustration. According to McKinsey,
This limits retailers' ability to grow their customer base and tap into new market segments. Poor sizing experiences can also lead to negative word-of-mouth, with dissatisfied customers sharing their experiences online, further tarnishing a brand's reputation. The cascading effect of missed sales, reduced loyalty, and customer churn underscores the critical importance of addressing sizing challenges to maintain a positive customer experience and foster brand allegiance.
The cost for the planet
Beyond the economic aspect, the environmental impact of fashion returns is substantial, contributing significantly to carbon emissions and waste. In the United Kingdom alone, according to Statista, online fashion returns in 2022 generated approximately 750,000 metric tons of CO₂ emissions, equivalent to 175,000 gasoline cars driven for one year. Notably, 350,000 metric tons of these emissions were attributed solely to reverse logistics—the process of transporting returned items back to retailers.
A considerable portion of returned fashion items cannot be resold as new due to damage or wear. Draper's estimates indicate that between 3% and 10% of fashion returns are unsellable, with 50% of these items ending up in landfills.

Landfill
Source: Katie Rodriguez, on www.unsplash.com/
This disposal not only contributes to environmental pollution but also represents a significant waste of resources used in the production of these garments.
The transportation involved in the returns process further exacerbates environmental concerns. The emissions from reverse logistics, combined with the initial shipping, amplify the carbon footprint of each returned item. For instance, the carbon emissions from transporting a returned item can be equivalent to driving a typical car for 10-20 miles.
The Solution: enter the virtual changing room
What is a Virtual Try On?
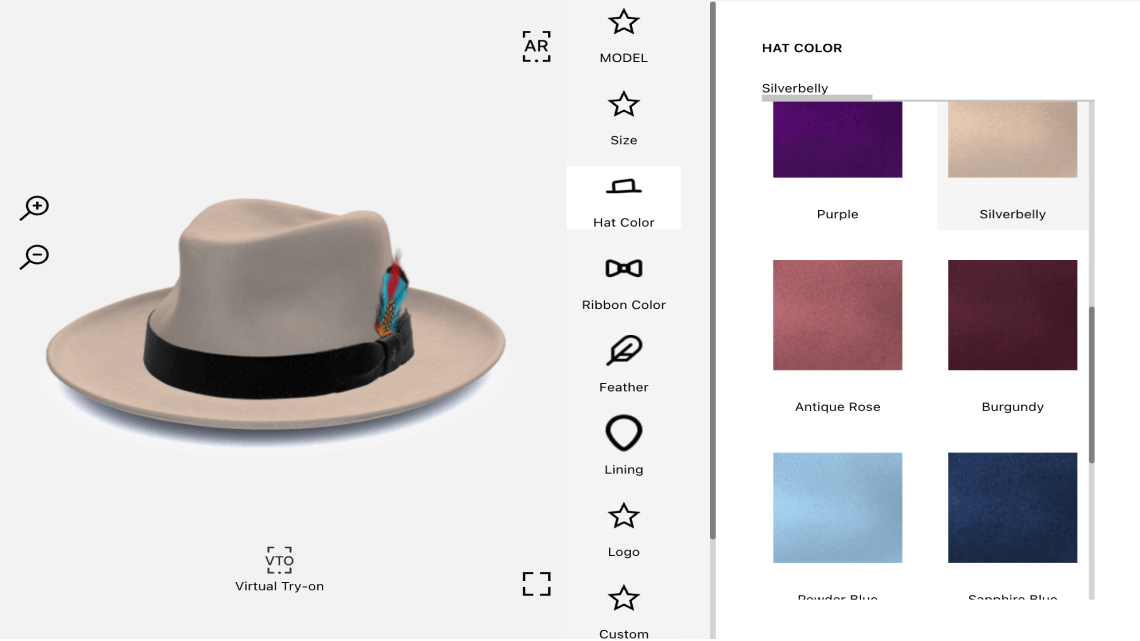
Part of the reason why a consumer enters a changing room in a physical boutique is to see how a fashion item (e.g. a dress) looks on them - enter the Virtual Try On, or VTO. VTO is an emerging technology in the fashion-tech world, and as such it is still loosely defined. The basic concept is to allow a consumer, typically within e-commerce, the possibility of seeing a garment, shoe, or accessory on a virtual person. The virtual person could be a generic avatar (3D or 2D), or an actual digital twin of the consumer. There are 6 main categories of VTOs currently on the market:
- The first approach is through Photogrammetry (combination of pictures), or the use of a 3D scanner to create a 3D digital twin of the product. This approach works reasonably well with “hard” goods, like shoes and accessories, but not with apparel. The reason for this is that Photogrammetry captures static images to build a static image, and hence has trouble capturing the complexities of fabric behavior, how it moves, texture and elasticity. Producing these assets typically costs $300 to $700 per product, depending on complexity of the product and quality of the output. Examples of players in this space are London Dynamics and Zakeke, amongst many others.
- The second approach to building a digital asset is through 3D design. This involves generating a digital paper pattern by either importing 2D garment patterns (the same used in a paper pattern for physical manufacturing), or drafting them directly in the software, and then adjusting them (e.g. sewn together). The software then uses advanced physics based algorithms to simulate fabric behavior and customize fabric properties. The result is a highly accurate 3D digital twin, that can be accurate not only in shoes and accessories, but also in apparel. If the software is not used throughout the product development process by the brand, recreating this digital asset typically costs $1,500 to $2,500 per product. Examples of software used to build this type of asset are CLO 3D, Browzwear, Marvelous Designer, Style3D, Optitex,Tukatech and Lectra Modaris.
Product configuration and customization with Zakeke.
Source: appsumo.com
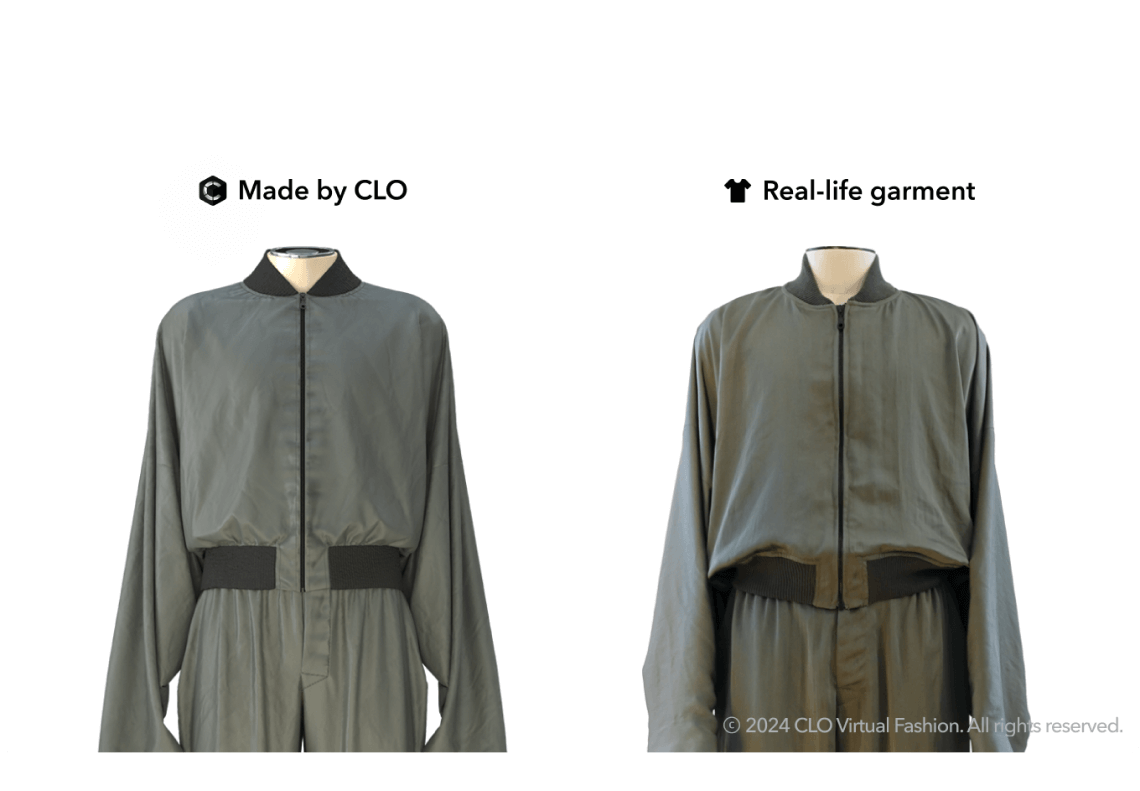
Digital twin, created by CLO
Source: www.clo3d.com
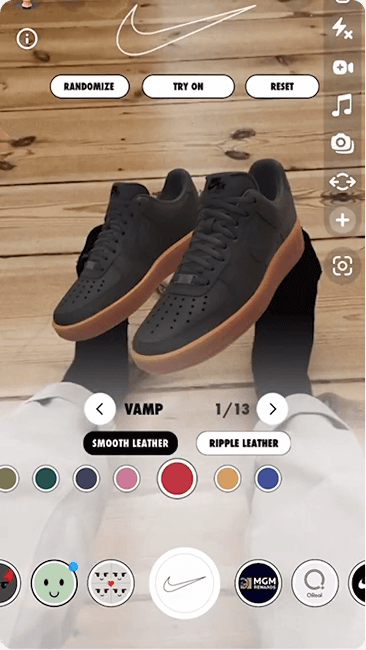
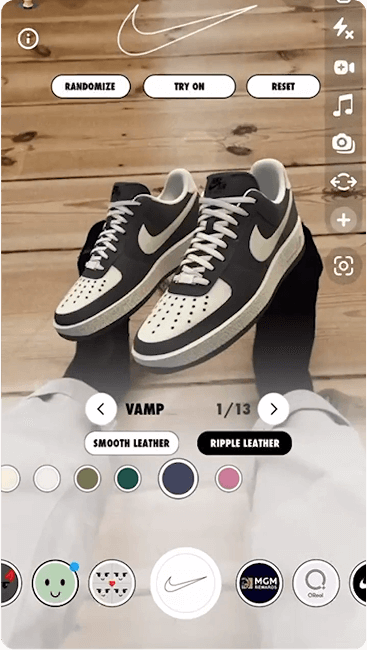
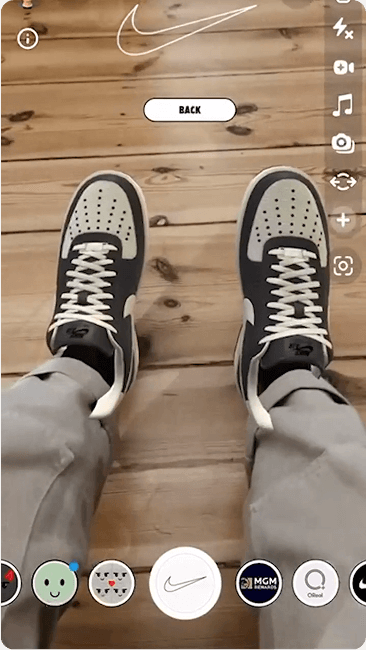
Augmented reality try-on on Snapchat
Source: www.snapchat.com
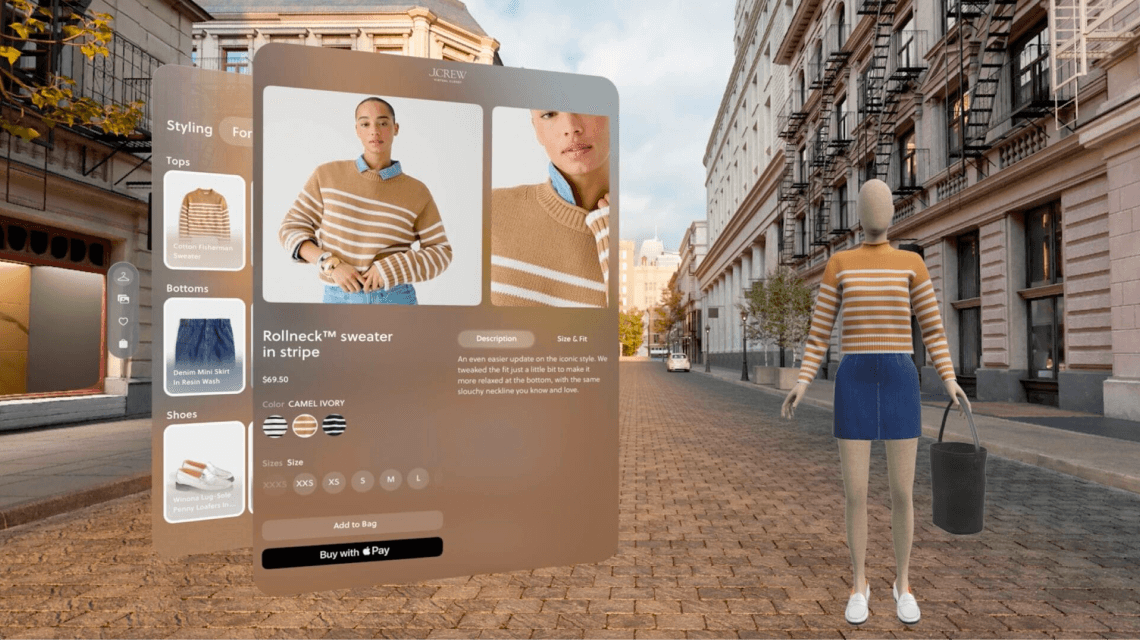
Augmented reality shopping
Source: www.obsessar.com
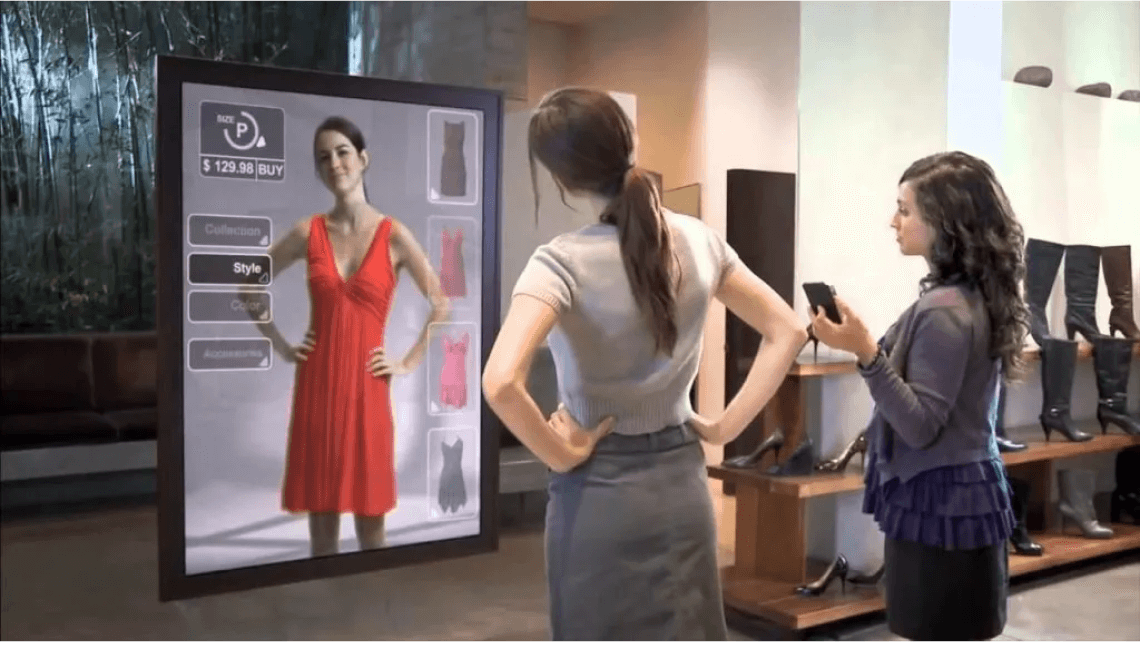
Smart mirror shopping experience
Source: www.quytech.com
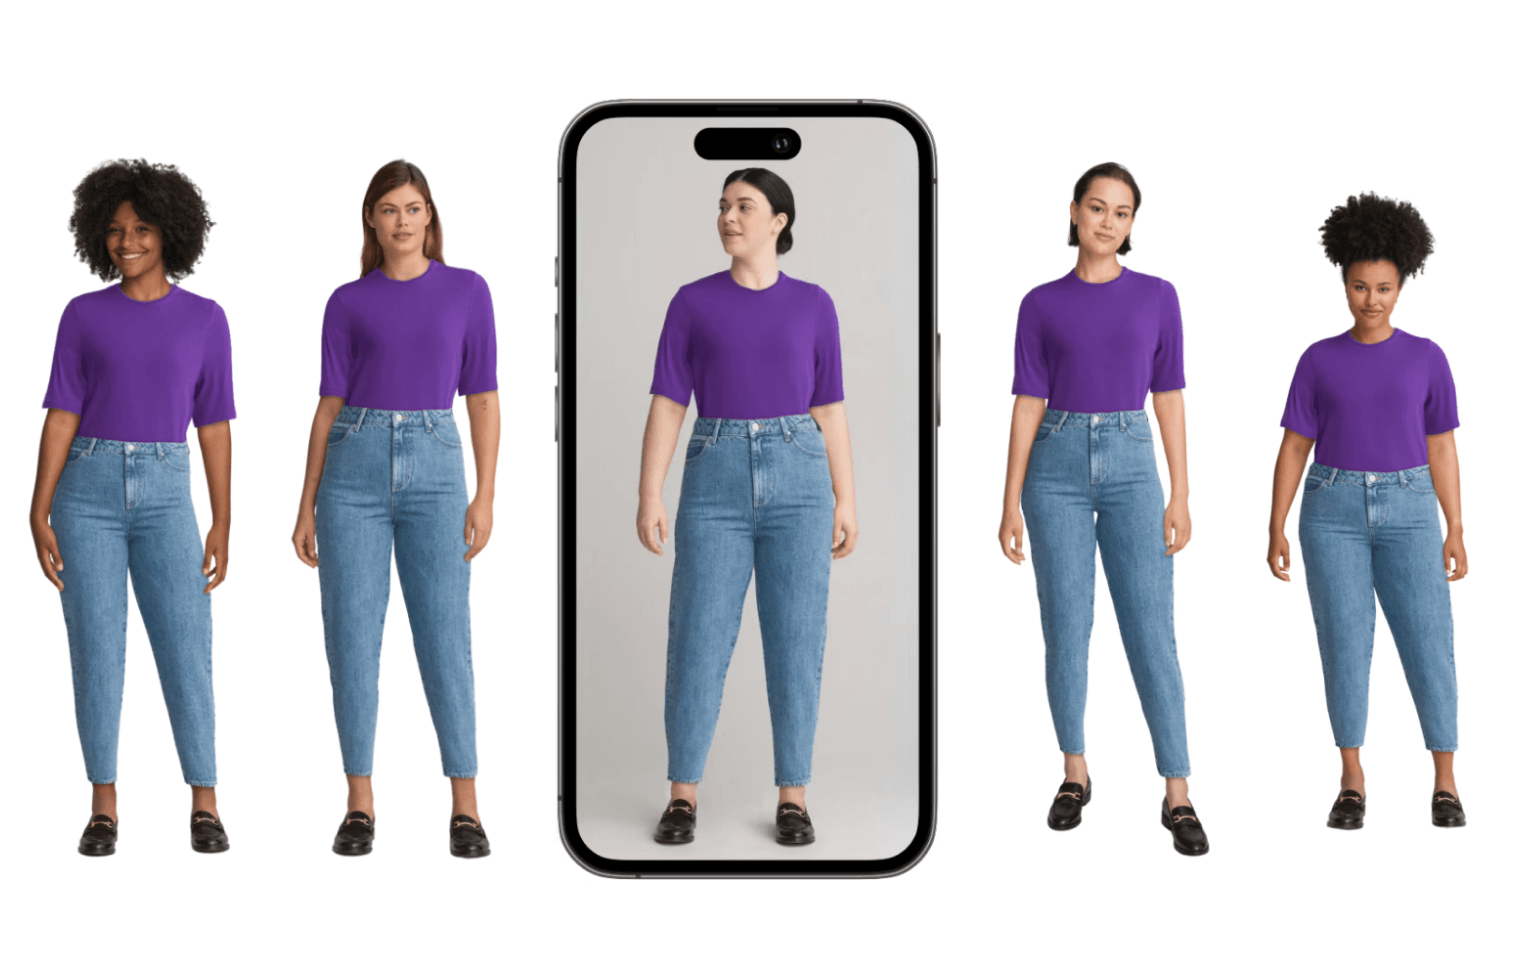
Digital twin of a garment worn by different 3D avatars.
Source: www.veesual.ai
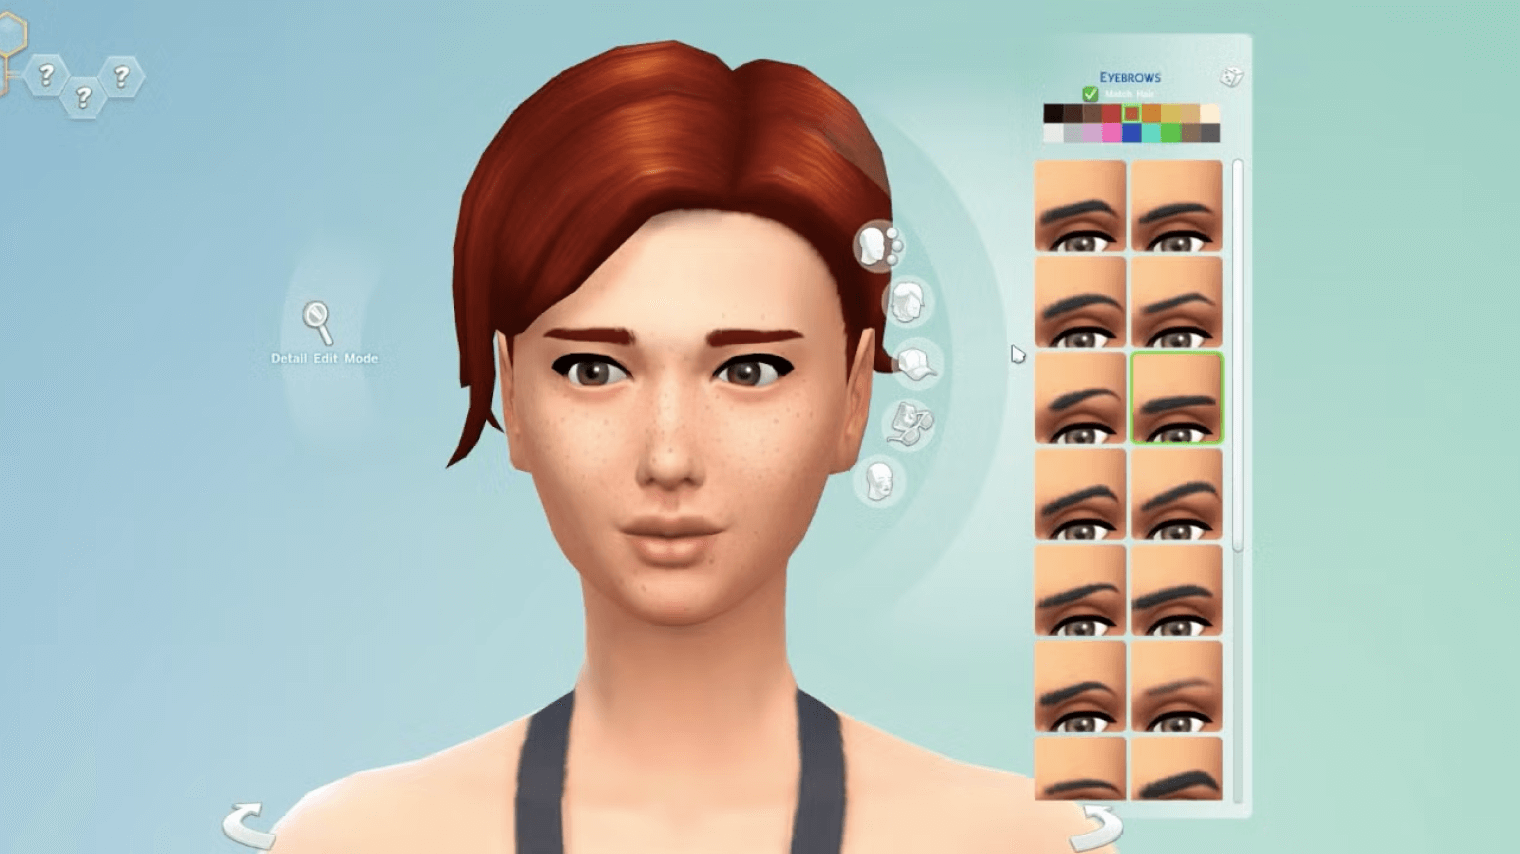
Create-A-Sim mode on The Sims 4.
Source: www.screenrant.com
What is a Size Advisor?
The other reason a consumer enters a changing room in a physical retail store, is to know what size fits them best. The VTO, as discussed above, helps the consumer understand how a garment looks on them, but not finding the right size. Enter Size advisors. Size advisors aim to support consumers, typically through e-commerce, in identifying the right size to purchase without having to physically try-on a garment. Unlike VTO, players have been trying to solve this problem since the early 2010s. While VTOs aim mostly to increase conversion rates and average order value, Size (and fit) advisors aim to increase conversion rates, average order value, and at the same time reduce size & fit returns, their environmental impact, and the burden on customer service.
Several approaches address this challenge, each differing in the effort required from the retailer, the complexity of inputs requested from the consumer, and the accuracy of the output. Some rely on a pure Machine Learning approach based on sales and returns data to make recommendations. Others aim to create a digital twin of the consumer's measurements in the backend, either through predictive AI, Machine Learning, or computer vision (e.g. asking the consumer to measure themselves using a picture). These methods are analyzed in more detail in the following section.
The dichotomy of the Size Advisor and Virtual Try On
While both Virtual Try-On (VTO) and Size Advisor players are working to solve this need, no comprehensive solution exists on the market at the moment. Why is that?
The reason behind this separation between the two technologies lies in the creation of the digital twin of the product. Creating a digital twin of the consumer is simple from a technological perspective, especially for Size Advisor solutions that recreate a digital twin of the consumer's body measurements. However, once the body is created, it needs to be dressed with a digital twin of the product. This takes us back to some of the challenges discussed above with the digital asset creation process.
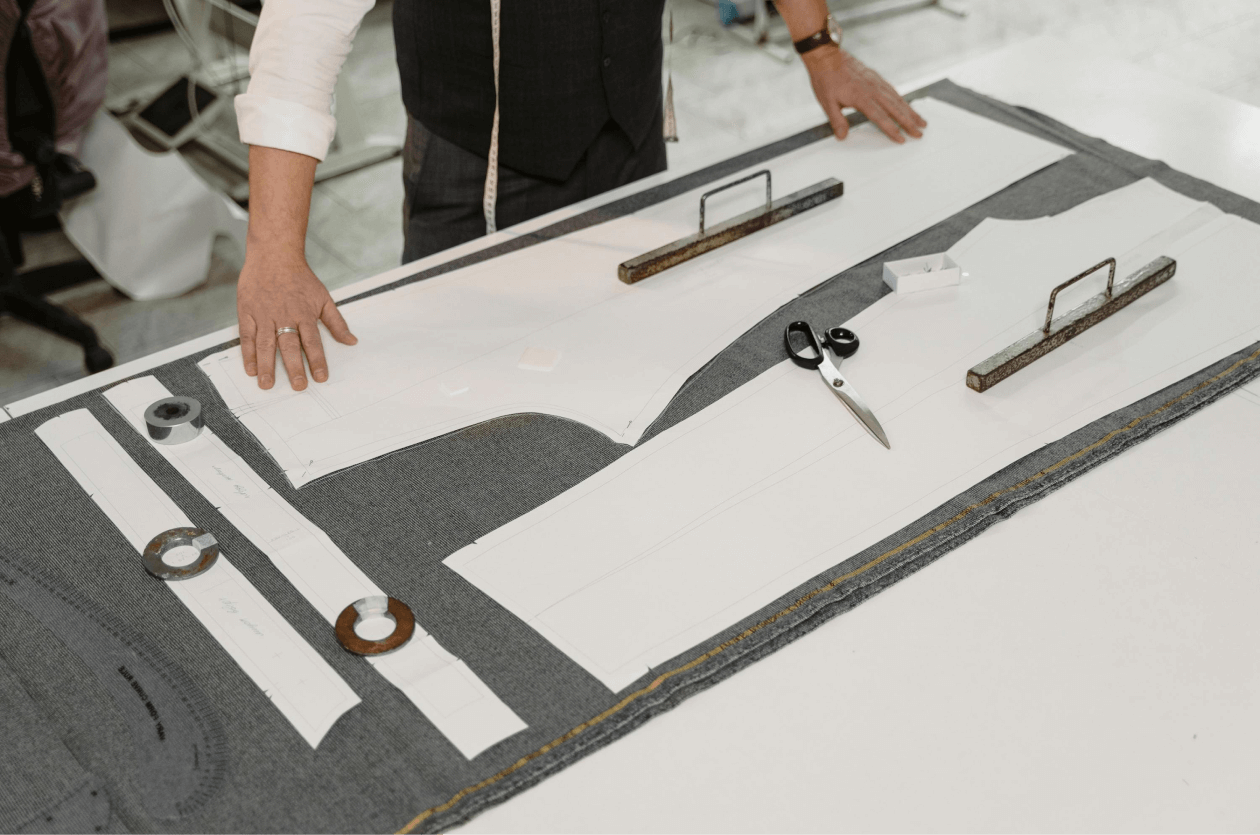
Paper pattern making.
Source: Tima Miroshnichenko on www.pexels.com
The benefits of introducing a Size Advisor
The goals brands should be aiming for
Implementing a Size Advisor to help consumers find the right size to purchase can yield substantial benefits to the shopper experience, e-commerce profit & loss, and sustainability of a retailer. Here are some considerations for brands and retailers to evaluate when deciding whether to introduce a Size Advisor, and throughout the selection process:
Quantifying the benefits of a Size Advisor
Considering the goals outlined above, assessing the impact or benefits of each axis for an individual retailer is a painful yet necessary exercise. Making the exercise additionally challenging is the task of normalizing KPIs, as often different providers will have differing definitions for each indicator. Below is our guide, with our full transparency on the KPIs achievable through Measmerize:
- Returns Reduction
- Customer Service calls
- Conversion Rate optimization
Our conversion rate is measured from PDP to Add to Cart, which is where the Size Advisor should have the most impact. We also measure and report from PdP to Order.
- Average Order Value
- Sustainability
- Adoption, or Recommendation Rate
- Open Rate: The percentage of PdP users that click on the CTA of the Size Advisor. As mentioned before, this is mostly impacted by the visibility given to the Size Advisor on the e-commerce page. At Measmerize, where a significant portion of our client-based is luxury players who prefer a minimalist CTA, we see an open rate of 3-6% of PdP users. Beware of providers that report an open rate of a different order of magnitude from the above, at parity of visibility. The user doesn't know which provider is behind the CTA before clicking, so given the same visibility of CTAs the open rate should not vary.
- Completion Rate / Funnel: This is the most important KPI when assessing efficacy of a Size Advisor provider, as it is directly impacted by the UX and UI of the solution. At Measmerize we see 75-90% of users who open the tool and interact with anything on the first page completing the process and receiving a size recommendation.
- Recommendation Rate: This is a simple multiplication of Open Rate and Completion Rate. As a result of the above KPIs, we see Measmerize clients with a Recommendation Rate (% of PDP users that receive a size recommendation) between 2.5% and 5.5%.
- Percentage of Sales based on a recommendation: This is the second most important KPI to monitor in assessing the quality of a size recommendation solution on sales. This is an indirect multiplication of Recommendation Rate and Conversion Rates (and AoV if measured in value, or $, instead of volumes). At Measmerize we manage on average between 15% and 25% of our client's total e-commerce sales.
- Return on Investment

Do size recommendation solutions work? The Golden Goose experience with Measmerize
Source: www.measmerize.com
How to choose a Size and Fit Advisor provider
Navigating a complex ecosystem
Even if they've truly started taking hold after the Covid-driven fashion e-commerce acceleration, Size Advisors have been around for 15 years. As a result there are many providers out there —at Measmerize we've mapped more than 40 competitors currently. They differ significantly in their approaches to providing a recommendation, using various inputs, data science techniques, and geographical focus. Assortment coverage (e.g. apparel, shoes, kids, jewelry) also varies from player to player.
Launching a solution that provides some sort of size recommendation is surprisingly simple, which does not however mean that the accuracy of the recommendation will be any good. In the following section we aim to provide a framework for retailers to assess the fit (pun intended) of a provider with their business needs.
While there are tens of providers that offer size recommendation services, we feel they can all be clustered into three/four macro models, or approaches, each with different benefits and limitations.
This approach relies almost exclusively on sales and returns data to build social proof that the size bought by other people in the same cluster should be correct for that consumer. Product measurements bear almost no weight in making the recommendation.
This approach doesn't require product / anthropometric measurements (hence has had a lot of success with multibrand retailers which don't have this information). Furthermore, it has a simple User Experience that maximizes adoption.
Because it heavily relies on sales & returns feedback loop, and not on product measurements, this approach has trouble capturing differences between SKUs, and requires a high volume of sales / SKU to achieve accuracy. Furthermore, it provides more statistical feedback that lacks personalization (e.g. no information on detailed fit of the product on the body).
This approach can be immediately accurate, without requiring a lot of sales & returns data. Furthermore, because it uses both body and garment measurements to make a recommendation it can provide detailed feedback on how a garment fits on the body.
Having to take a picture of yourself, from a specific distance, with a specific outfit (e.g. a hoodie wouldn't allow you to capture the correct outline of the body) requires minutes and effort, making User Experience very complicated. Furthermore, consumers are increasingly worried about privacy. This results in VERY low adoption rates, ultimately minimizing the benefit of the Size Advisor's benefit on both sales and returns. This approach also requires product measurements, making it harder to implement on multibrands.
This approach is immediately accurate, as it leverages body measurements and compares them to garment measurements. Furthermore, because the User Experience for the consumer is very quick (less than 1 minute) it can also deliver great adoption rates.
The key downside of this approach is that it requires product, or anthropometric, measurements - making it harder for multibrands to implement.
By making an initial recommendation on very basic inputs, they simplify the UX and maximize adoption. They can also provide detailed feedback on how a garment fits on the body.
Taking a picture remains a complex UX step, so most size recommendations rely on basic inputs such as age, weight, height, and gender. This oversimplified approach assumes that all men who are 35 years old, weigh 85 kg, and stand 185 cm tall have identical body types — failing to account for individual differences. These differences are particularly important given that Size Advisor users typically fall outside the "average" body range. Consumers with standard body types are less likely to use a size advisor, whereas those with unique features, like broad shoulders, are more inclined to seek one. As a result, this method often delivers very inaccurate recommendations.
Once a retailer has identified which macro model is best for their business needs and individualities, it becomes even harder to understand the differences between players that use the same approach. Below we provide a guideline of due diligence questions we recommend assessing in order to accurately compare solutions:
- What level of customization can be achieved in terms of design and layout, for both the widget (interface) and the call to action?
- Can the copy — or wording — of the questions be customized to reflect my brand's tone of voice?
- What are the exact inputs required from the shopper? Which are mandatory and which ones are optional?
- What is the percentage of users that completes the process, once the solution is opened (see our section on KPIs above for more details)?
- What is the increase of Conversion Rate and Average Order Value of users that receive a recommendation vs. traditional size guide users, and vs. users that don't use either (see our section on KPIs above for more details)?

Teamwork on the product User Experience.
Source: Unsplash
- What product information do you require to make a recommendation?
- How do you check the accuracy of the product information we provide?
- How do you train your algorithms?
- What data sets did you use to train the algorithm to make body estimates? How large is it? How geographically diverse? Do you own it?
- How many recommendations have you made over the past 3 months?
- What is the geographic breakdown of the recommendations made by the provider? How does it compare to the geographic presence of the retailer's users?
- How do you account for differences in bodies across geographies and ethnicities?
- Do you use the same recommendation algorithm across all your clients? If not, how are clients allocated to different algorithms? What are the differences?
- What is the return rate difference between shoppers who follow the size recommendations and those who don't (see our section on KPIs above for more details)?

Size recommendation accuracy.
Source: Unsplash
- Are you compliant with the privacy regulations in my countries of operation (e.g. GDPR, PIPL, California, …)?
- How many different privacy policies do you have? How are they differentiated by which geography?
- What is the legal basis for managing consumer data? Do you use consent?
- What cookies does the solution use? Are these placed based on consent? Where is the consent collected? If collected on the retailers site, how do you ensure it is respected?
- What is your accessibility level according to USA legislation?
- What security certificates and external assessments do you have?
- How often do you do external penetration testing? Can you share the latest result?
- Where are your servers located? What geographies does each server serve? Where is consumer data stored?
- Do you transfer EU data out of the EU? China data out of mainland China? If yes, to where, and based on what legal premise?
- How is data segregated on your databases between different clients?
- What automated tests do you have to ensure that development doesn't crash the solution during critical times?

The tech side of product development.
Source: Trevor Vannoy on Unsplash
- What product information do you need to make a recommendation? What information is mandatory and what information is nice-to-have?
- In what format do I need to provide product data? How often?
- In what format do I need to provide sales & returns data? How often?
- Are data flows automated or manual?
- How does the integration work? Where is the solution integrated into? How much code?
- Can you break down the process to go-live? What timeline?
- How long is the onboarding process for the assortment of the first collection? For the following seasons?
- How is reporting of the solutions performance monitored and assessed? On a dashboard? Business reviews? Does it integrate directly into my existing analytics solution?
- What KPIs can I see? How can I break them down? To what granularity?
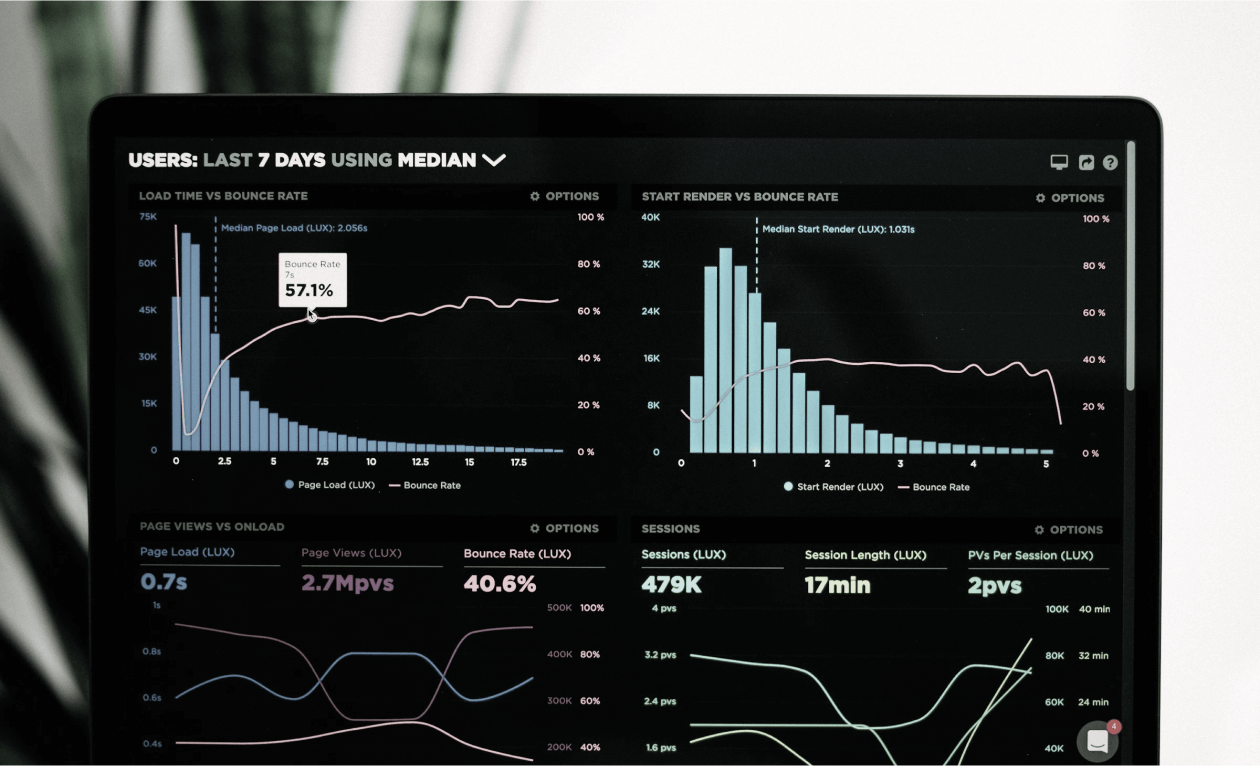
Dashoboard for data monitoring.
Source: Unsplash
We hope this article was useful for you and your company.
Reach out to our team to discuss how we can support your specific business needs.